carputilsGUI
The carputilGUI is a web-based interface to parametrize, run and visualize the openCARP examples. carputilsGUI is intended for new users who want to get an impression of the kind of simulations that can be run with openCARP and have no experience with command line tools. As such, carputilsGUI will also be the interface of choice for many educational settings when the focus is on understanding basic electrophysiological prinicples rather than having access to the full flexibility of openCARP. If you want to conduct a research projects, the carputils Python interface on the commandline will be the best way to interact with the simulator, though.
This README covers
You can also check out the video tutorials covering these topics.
Installation
Prerequisites
- Install Docker version 19.03.5 or later.
- For Linux users, additionally install Docker-compose 1.24.0 or later.
- For macOS or Windows, you need administration rights for your machine during installation
Linux
On Debian, you might also need to add permissions to resolve.conf
sudo chmod o+r /etc/resolv.conf
and add
{
    "dns": ["8.8.8.8"]
}
to /etc/docker/daemon.json and restart the Docker service:
sudo service docker restart
macOS or Windows
Start the downloaded program "Docker Desktop".
All operating systems
Quick start
- Download docker-compose.yml and database.conf to the same folder.
cd path/to/folder/including/docker-compose.yml/and/database.confdocker-compose pull && docker-compose up. Usesudobeforedocker-composeif required.- Enjoy carputilsGUI in your webrowser: http://localhost/examples
carputilsGUI developers
You could also work with carputilsGUI codebase and build it on your own.
Checkout the repository by using a command line terminal
git clone https://git.opencarp.org/openCARP/carputilsgui
Then, run docker-compose for building all images and volumes. Use sudo before docker-compose if required (Windows users need to login to Docker Desktop app with their Docker account):
cd path/to/folder/carputilsgui
docker-compose up
The process takes a while, so please don't interrupt. When the process finishes and the terminal displays the message "flask | WSGI app 0 (mountpoint='')" (may be not the last entry), press Ctrl+c in the terminal for exit.
Deploying multiple instances
If you want to depoly multiple containers running carputilsGUI on a server (e.g. for a workshop or other educational setting), the scripts provided in the carputilsGUI-ansible project might be interesting for you.
Usage
Starting the webApp containers
cd path/to/folder/carputilsgui
docker-compose start
following a webrowser (checked for Chrome and Firefox) type:
http://localhost/examplesYou can follow the experiments at:
https://opencarp.org/documentation/examplesThe carputilsGUI runs the run.py steps of the experiments with the optional parameters and visualize the 2D or 3D results. The --visualize parameter is not required for the carputilsGUI.
If the experiment doesn't have a run.py step or has previous steps without it, you can open a new terminal tab and type:
docker exec -it flask /bin/bash
cd /examples
and follow this extra steps.
Running experiments
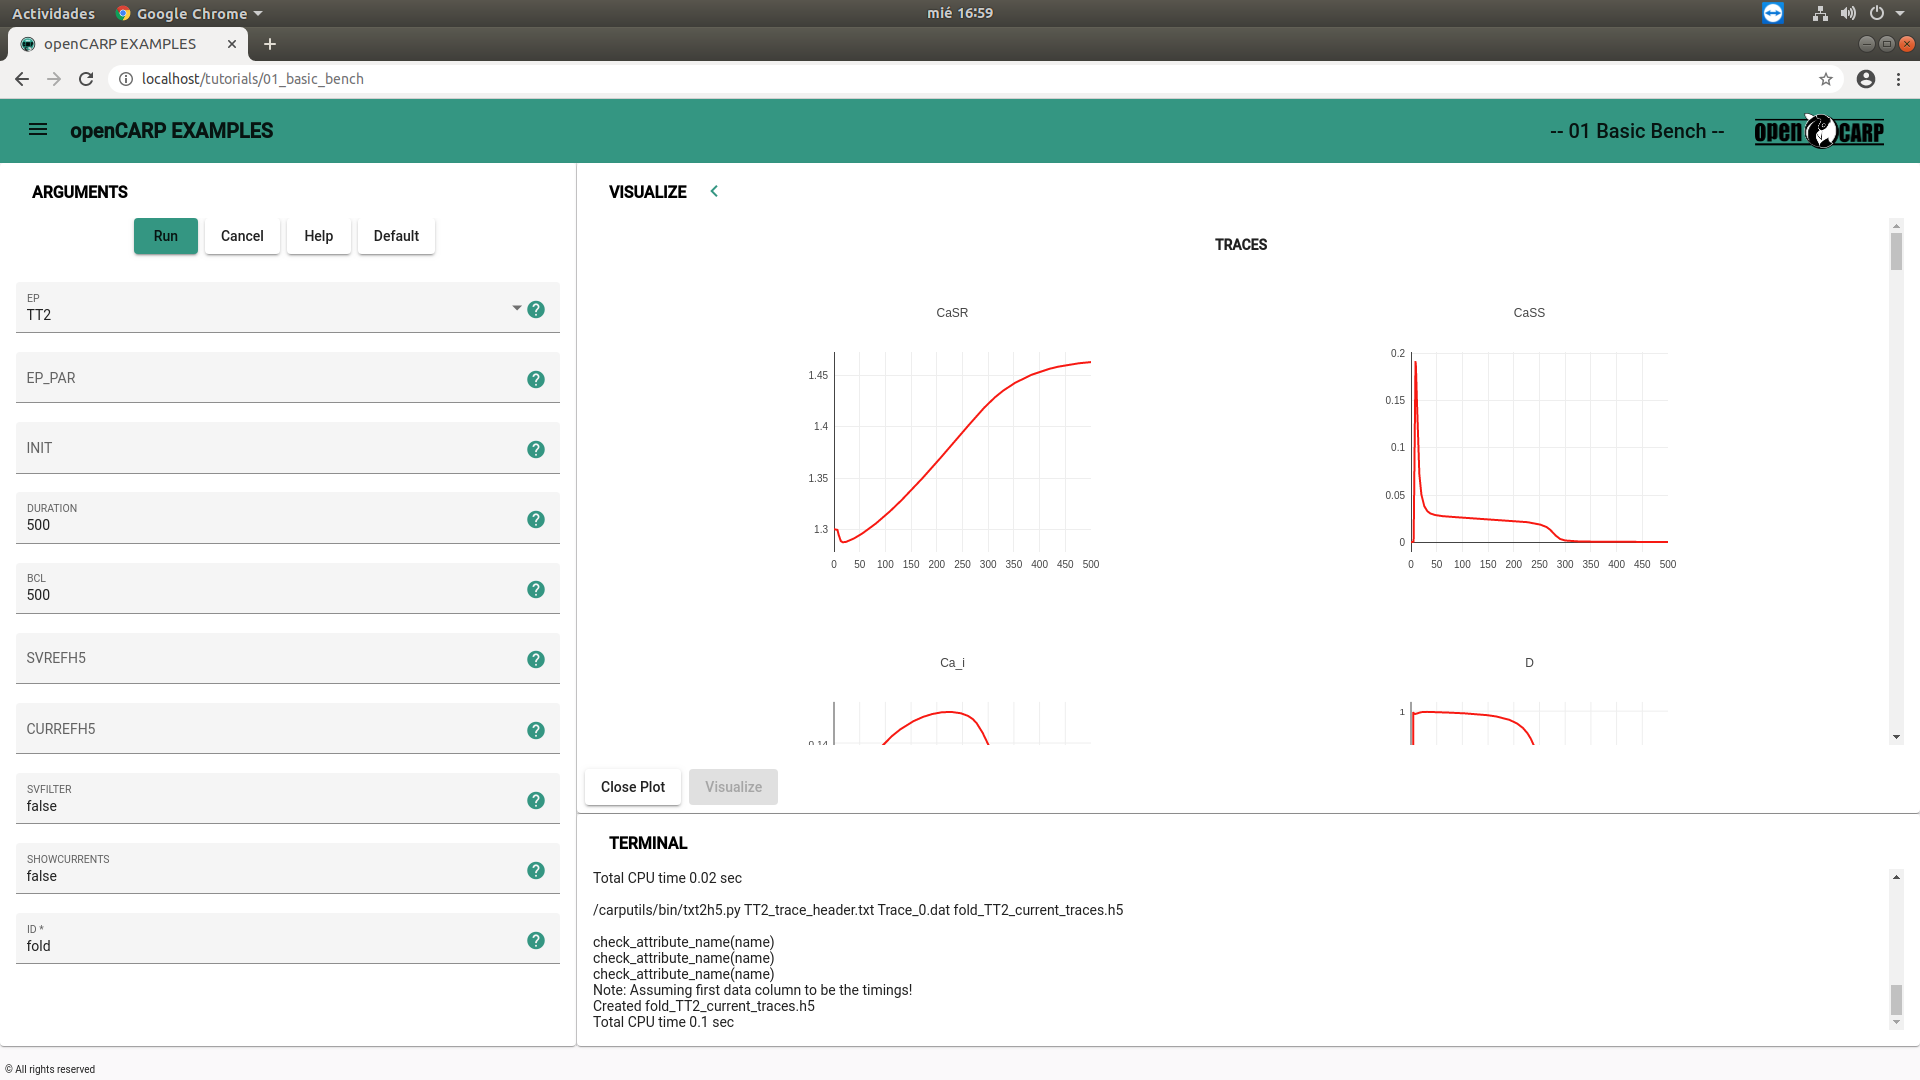
You can select the desired in silico experiment from the menu. carputilsGUI offers a subset of the openCARP examples.
You can get mor info on the parameters that are exposed by clicking on the ? icon next to them. The example documentation
provides a comprehensive overview with some background and can be accessed via the web page or the Help button.
Start the simulation by clicking the Run button. You can watch the simulation output in the terminal panel on the bottom of the window. Once the simulation
has finished, either the Plot or the Visualize button will become clickable depending on whether the output is a graph or a 3D visualization.
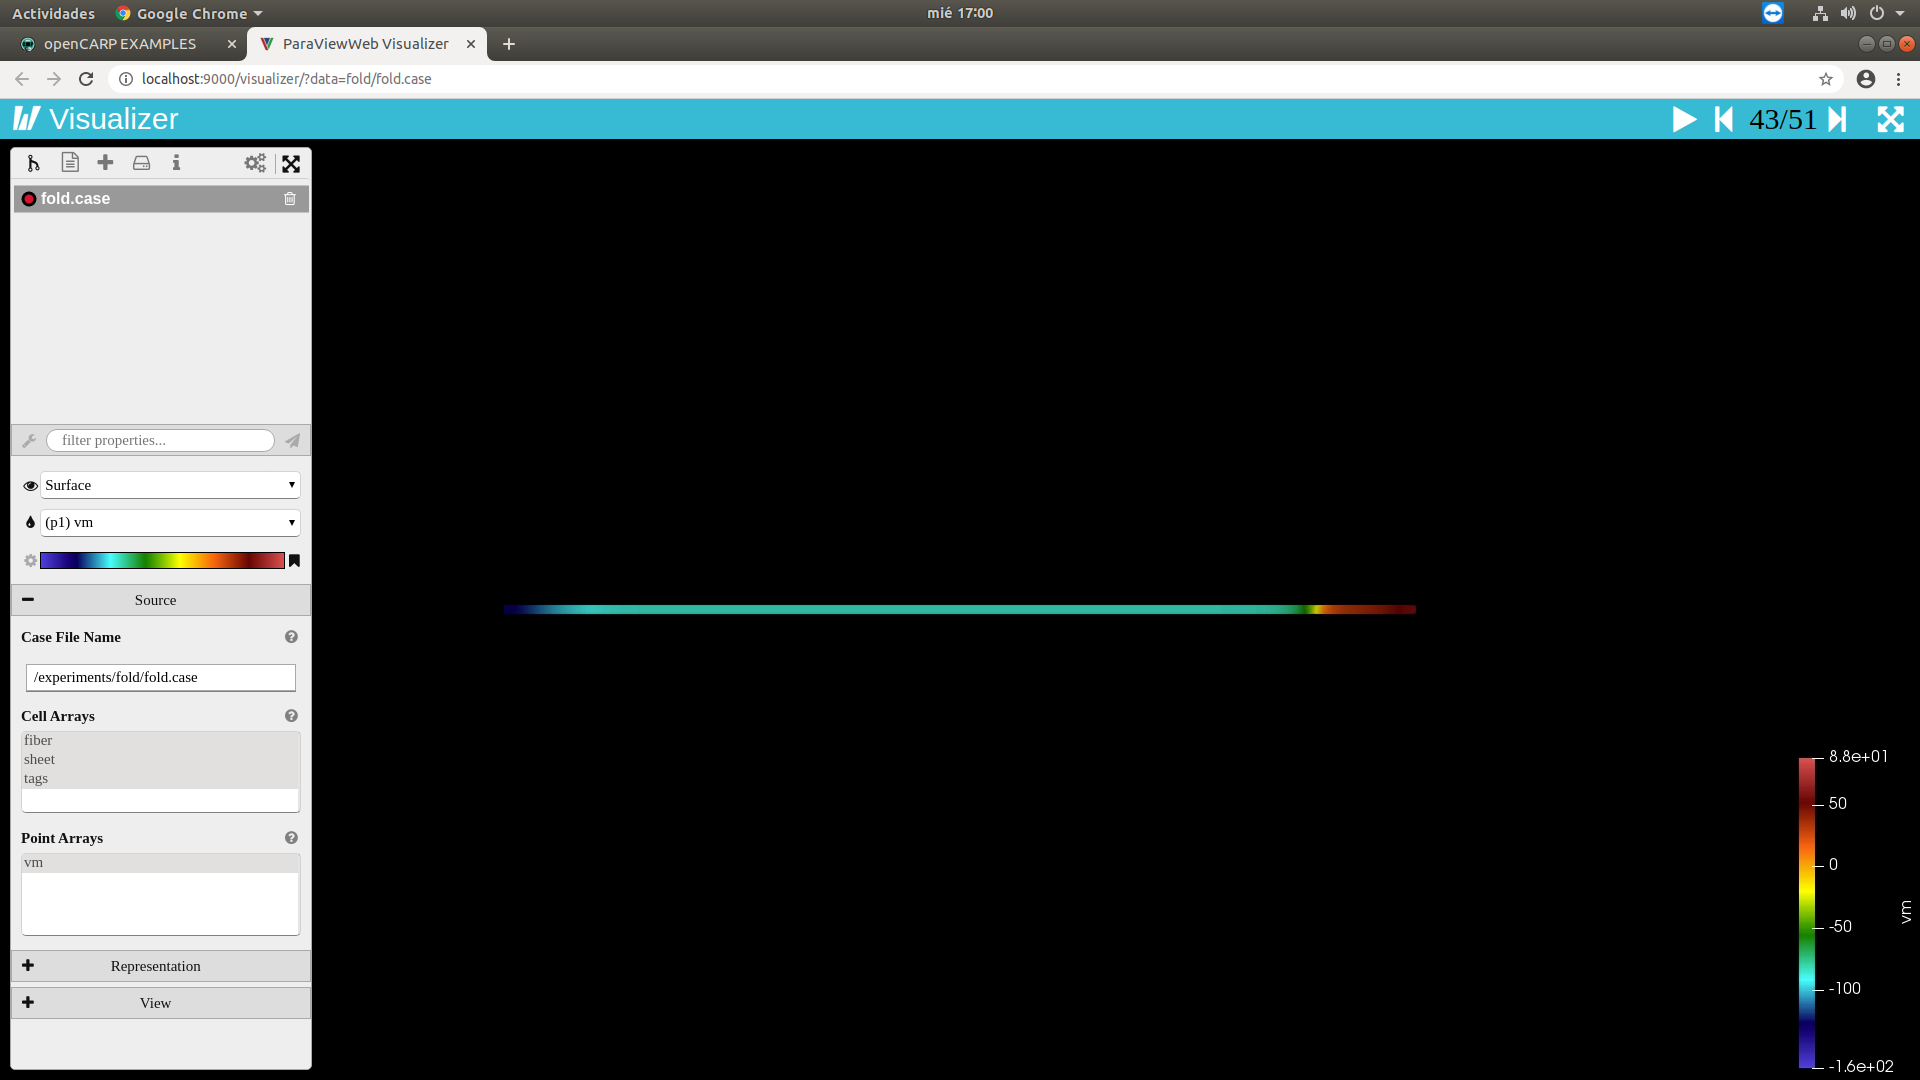
Plots can be manipulated interactively and you can download the result as png. 3D visualization are provided through Visualizer, a ParaView like web application.
Accessing output data & direct interaction
You can access the filesystem and commandline interfaces by opening a shell within the opencarp Docker container by calling
docker exec -it flask /bin/bash
from a terminal.
The examples are located under /example with a folder hierachy representing the examples structure.
When running a simulation, output data are stored in a separate folder created in the respective example folder. The default name is exp and
can be controlled via the ID field in the GUI. To copy these results from the Docker container to your host for further processing and persistent
storage, you can use the docker cp command on the host. For example docker cp flask:/examples/02_EP_tissue/05B_Conductive_Heterogeneity/exp .
to copy the output of experiment 02/05B to the current working directory of the host.
From the bash inside the container, you can also call all openCARP, bench and carputils commands.
bench --list-imps will give you a list of available ionic models for example. If you want to learn more about available parameters and state
variables of a specific model (e.g. TT2), you can call bench --imp=TT2 --imp-info. The available commands and parameters are detailed in the
respective documentation documents.
Stopping the webApp containers:
cd path/to/folder/carputilsgui
docker-compose stop
Optionally if you want to clear up all (remove) containers and volumes from app:
cd path/to/folder/carputilsgui
docker-compose down -v
Updating
If you want to update carputilsGUI and the underlying examples, stop the containers and delete the carputilsgui_app and carputilsgui_web_server images. Then, pull the updates and restart the containers.
docker-compose down -v
docker rmi carputilsgui_web_server carputilsgui_app
git pull
docker-compose up
Hints
- In the ParaViewWeb Visualizer, the colormap is scaled to the range of the first time step by default, which can be very narrow if the tissue has not been depolarized yet (e.g., 1mV around the resting membrane voltage). In many cases it makes sense to rescale to the range of the entire simulation time. To do so, click on the file that is visualized (e.g., exp.case), then on the gear wheel next to the colorbar and then on the horizontal arrows and then on the clock icon. If you want to show the colorbar, click on the flag on the right side of the colorbar in the menu.